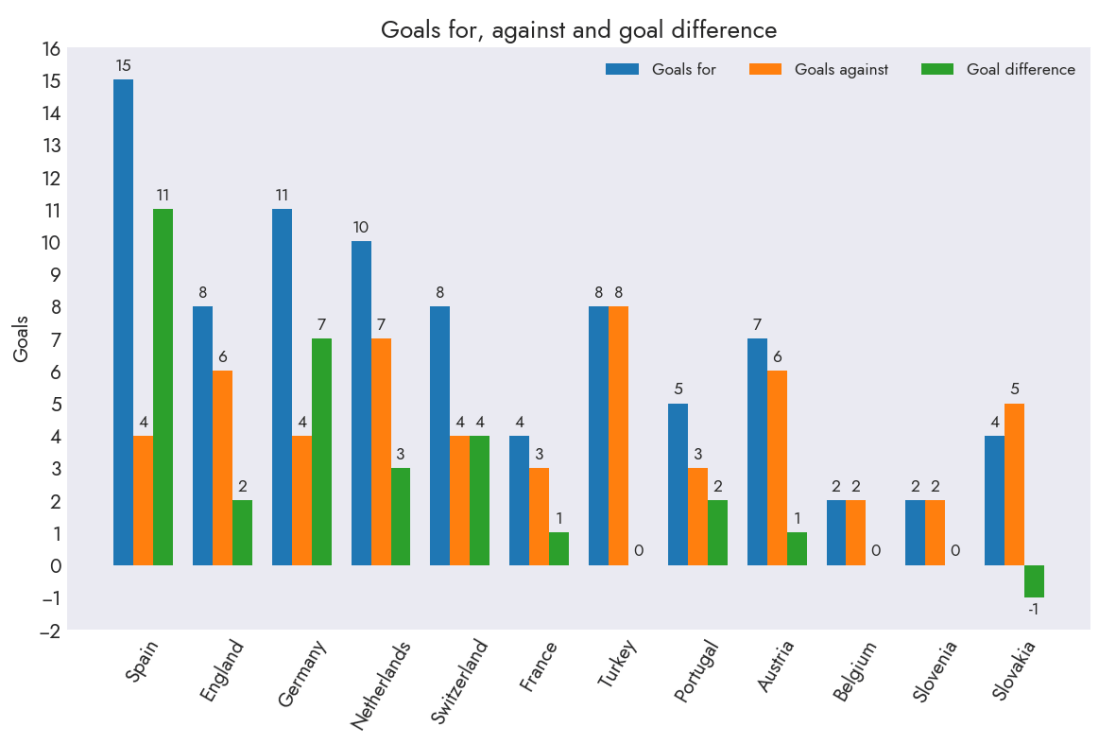
Even though it feels like football's never coming home, I still enjoy the buzz and excitement of an international tournament every couple of years. Sports statistics is another avenue for data visualisation I've been curious about recently so I thought it's worth delving into each team's performance stats using Python and Matplotlib. The code for … Continue reading Euro 2024 Tournament Data Visualised with Python
Euro 2024 Tournament Data Visualised with Python