A Sankey diagram is a visual representation of the categories and flow of quantities from one set of starting values to another set of end values. These diagrams are named after the Irish engineer Matthew Sankey who introduced the first such energy flow diagram in an 1898 article on the efficiency of steam engines [1]. They are often used to show the transformation of natural resources, information and energy through processes that have a set of outputs. As an example, we might think of the literal flow of the water supply to a big city. The source of water might be a combination of reservoirs, dams and aquifers, while its consumption could be split up into categories such as domestic, business or industrial use. In cases like these, Sankey diagrams are a great tool for data visulisation. The width of the Sankey arrows are always proportional to the magnitude of a flow and the sum of the inputs should equal the sum of the outputs.
My aim in this project was to use Python to create Sankey diagrams to visualise the flows of three separate energy commodities in the UK:
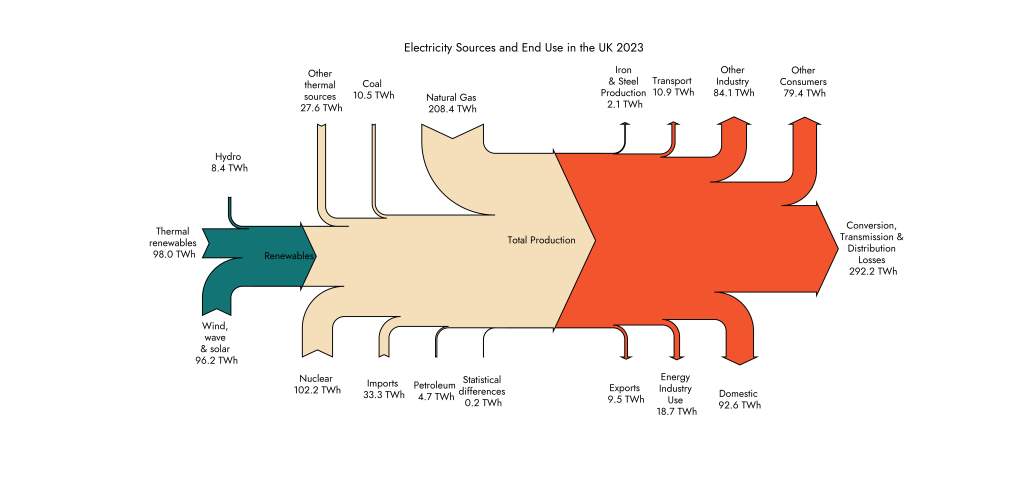
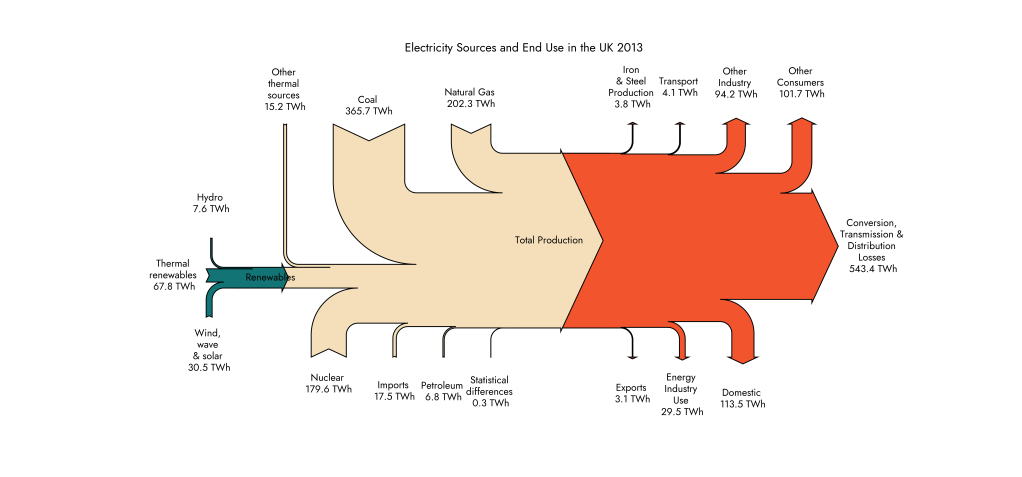
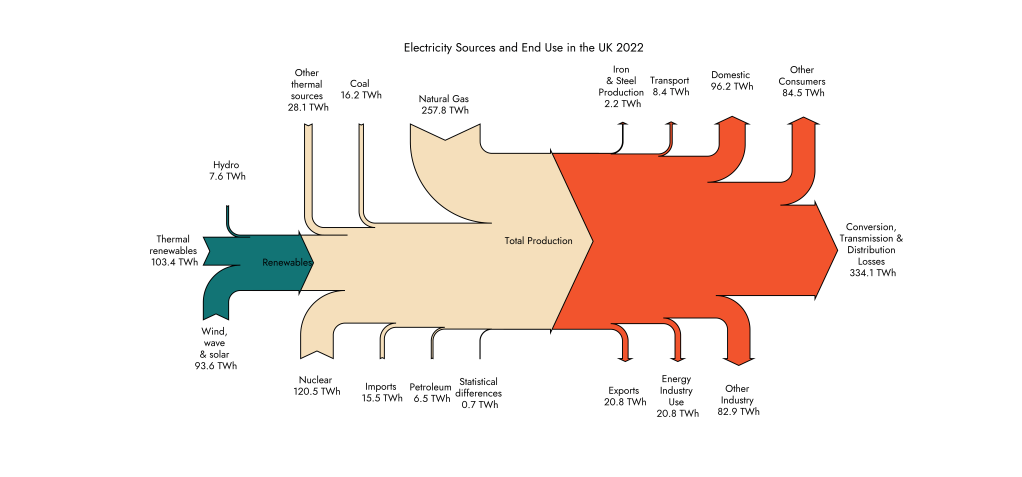
- Sources of generated electricity and the end uses comparing the years 2023, 2022 and 2013 (a decade ago from the latest data for 2023)
- Natural gas inputs and end users for 2023
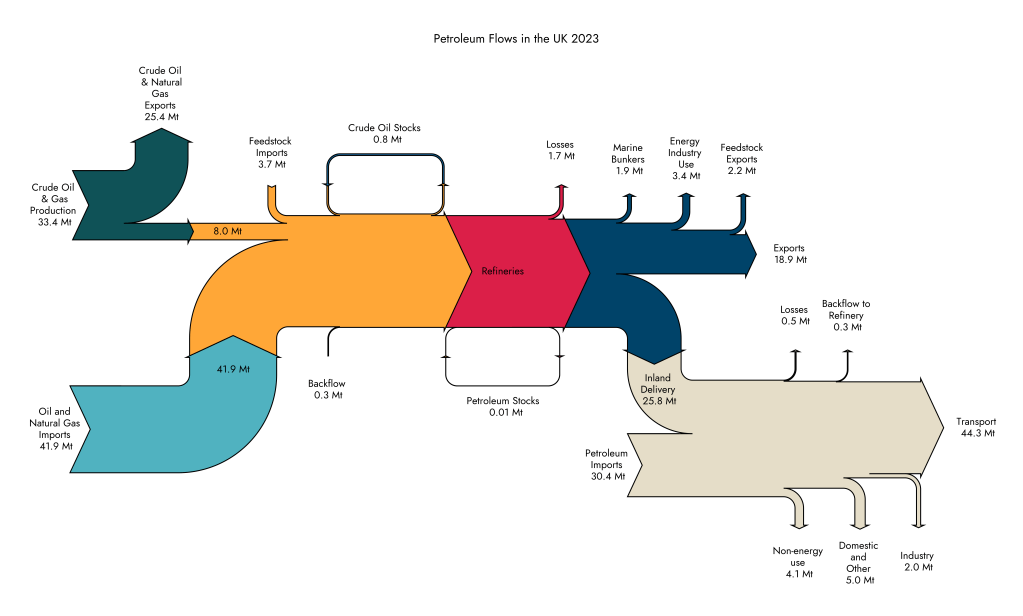
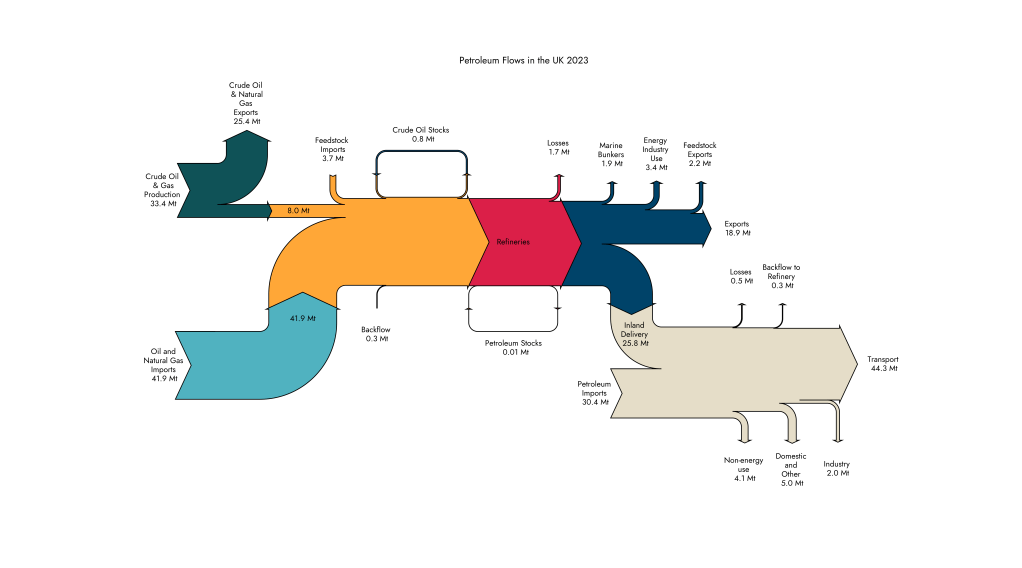
- Petroleum production, imports and end users for 2023
I chose to focus on the energy sector as I have a strong interest in how our energy sources are changing over time as well as there being a lot of readily available information in UK government reports. Data was pulled from the Digest of UK Energy Statistics (DUKES) for the years 2023 [2], 2022 [3] and 2013 [4]. The DUKES does include its own Sankey diagrams from which data were used, however I have tried to make a significant improvement on the presentation. The Python code for these visualisations can be found in the linked GitHub Repository.
Charts in the gallery below can be expanded by clicking on them and are best viewed on a large screen. For electricity and natural gas, the units of energy used are terawatt-hours (TWh), whereas for oil we are looking at megatonnes (multiples of one million metric tonnes of oil). More detail on the units after the charts.
Expandable Gallery

Slideshow of Charts
A note on units
A terawatt-hour is a huge amount of energy relative to a person’s daily use but we are talking about a whole country’s consumption in this case. A Watt is actually a unit of power, or in other words, energy transferred per unit time (a second), where 1 W = 1 Joule of energy per second (J/s). We can see from these units that multiplying Watts by time will give us energy in Joules. However, energy can also be expressed as Watt-hours, where:

To put things in perspective and without going too deep into the maths, we can Google around and find out that boiling 1 litre of water in a kettle requires roughly 330 kJ of energy. So, a terawatt-hour is enough to boil 10 billion litres of water or about 4000 Olympic swimming pools.
Documentation on the ‘sankey’ Python module from [5] was used alongside useful examples in the blog post in [6]. The electricity Sankeys are quite striking as they show just how much of the electricity coming out of power plants is wasted in transmission. Fortunately, we are seeing this waste slowly but surely decrease with technology improvements.
References
[1] “Who is this Sankey guy? – Sankey Diagrams,” Sankey-diagrams.com, Apr. 12, 2007. https://www.sankey-diagrams.com/who-is-this-sankey-guy/ (accessed Jan. 28, 2025).
[2] “Digest of UK Energy Statistics (DUKES) 2024,” GOV.UK, Jul. 29, 2024. https://www.gov.uk/government/statistics/digest-of-uk-energy-statistics-dukes-2024
[3] “Digest of UK Energy Statistics (DUKES) 2023,” GOV.UK. https://www.gov.uk/government/statistics/digest-of-uk-energy-statistics-dukes-2023
[4] “Digest of United Kingdom energy statistics 2014: internet content only,” GOV.UK, Jul. 31, 2014. https://www.gov.uk/government/statistics/digest-of-united-kingdom-energy-statistics-2014-internet-content-only
[5] “matplotlib.sankey — Matplotlib 3.10.0 documentation,” Matplotlib.org, 2025. https://matplotlib.org/stable/api/sankey_api.html
[6] Florian Le Bourdais, “A tutorial about drawing Sankey graphics using matplotlib | Frolian’s blog,” Github.io, Jan. 13, 2016. https://flothesof.github.io/sankey-tutorial-matplotlib.html
