Even though it feels like football’s never coming home, I still enjoy the buzz and excitement of an international tournament every couple of years. Sports statistics is another avenue for data visualisation I’ve been curious about recently so I thought it’s worth delving into each team’s performance stats using Python and Matplotlib.
The code for these graphs is available in my GitHub Repository.
Grouped Bar Charts for Goal Stats
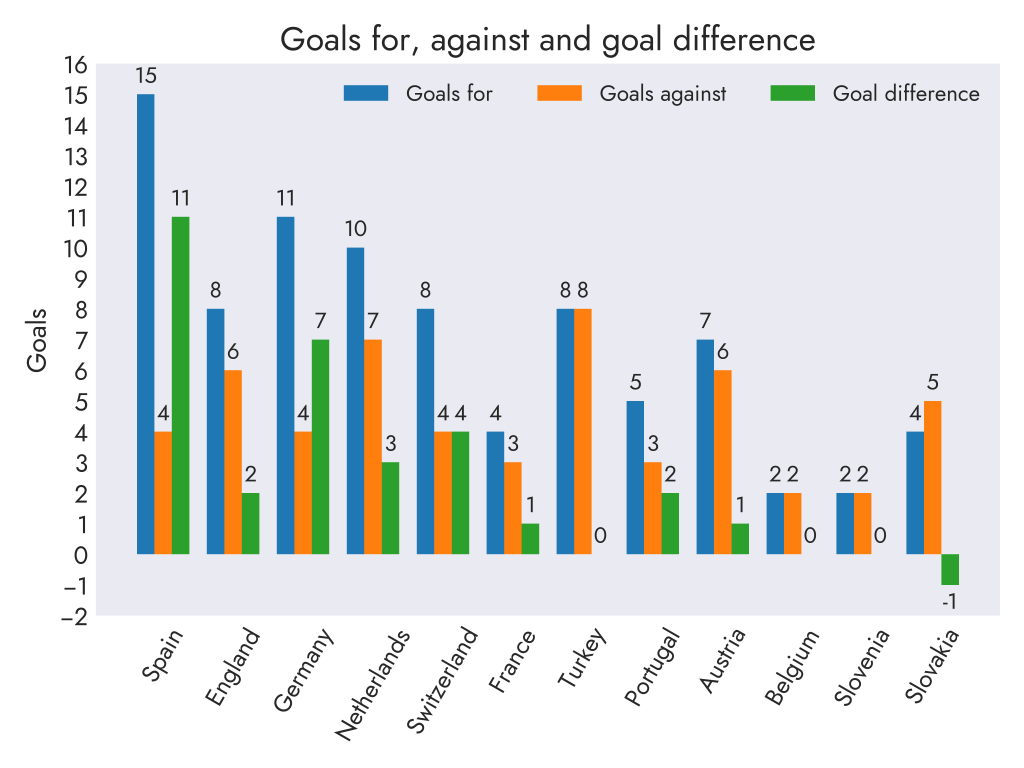
Figure 1 – Goal statistics for the top 12 teams ranked using the points and goal difference system
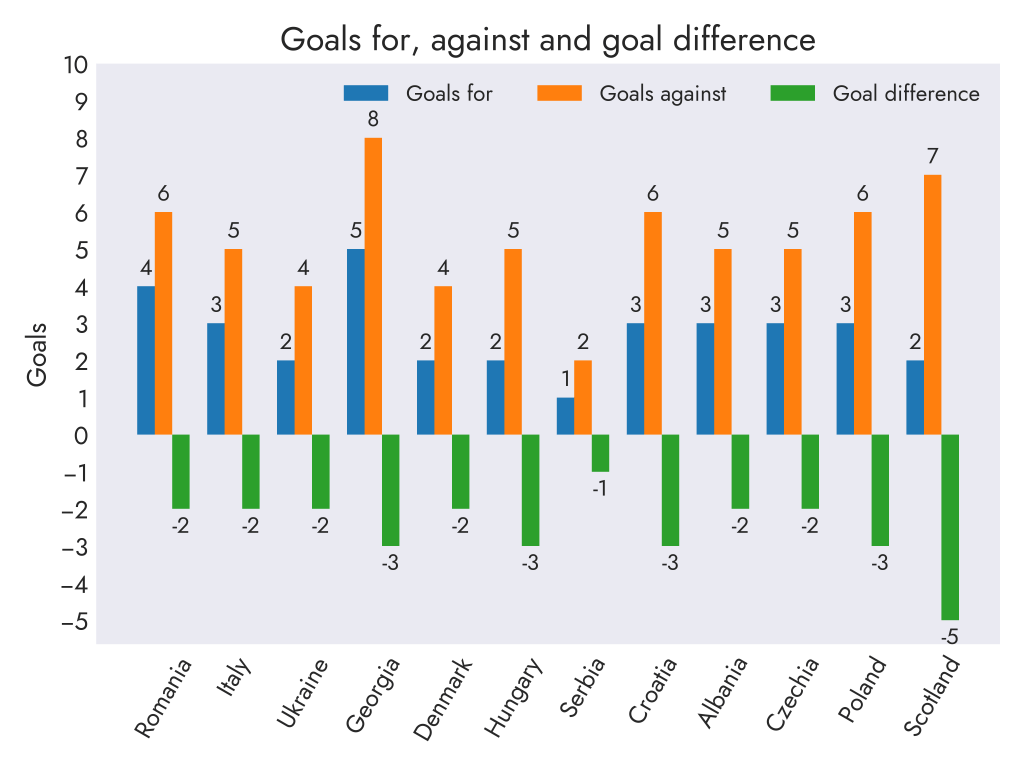
Figure 2 – The same statistics but for the last 12 ranked national teams
Heatmaps for Possession
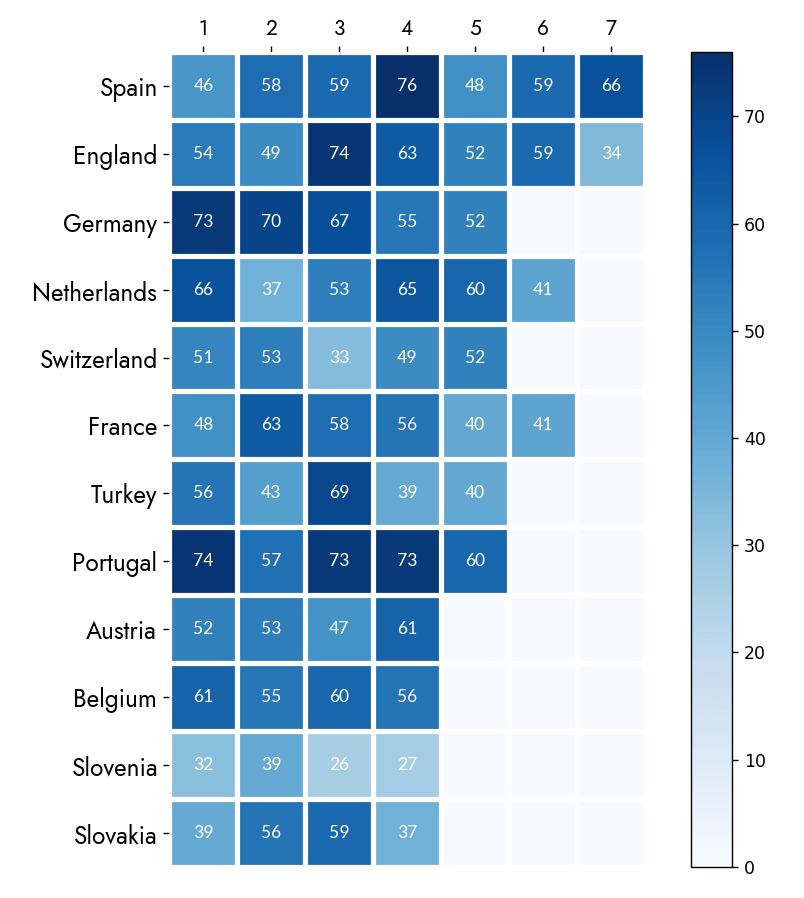
Figure 3 – Percentage possession in games played by each national team. The number of games depends on how far a team got through the tournament.
Interesting to note evidence of European champions Spain relying less and less on ‘tiki-taka’ compared to their 2008 and 2012 campaigns. Portugal, Netherlands and Germany’s high possession sticks out, but perhaps it didn’t help conserve energy for tougher opponents deeper into the finals.
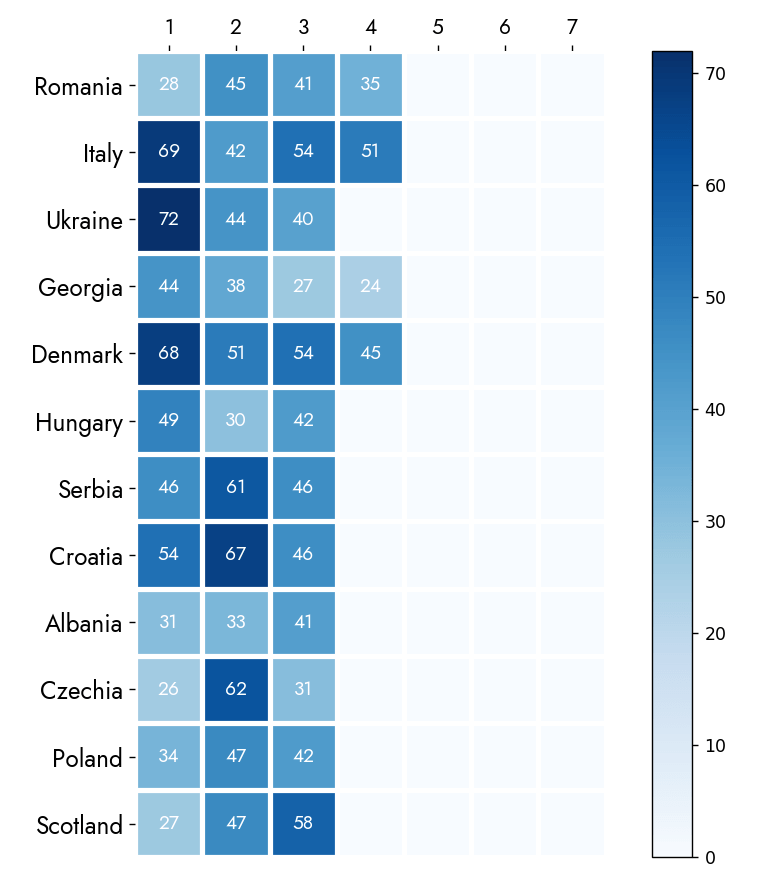
Figure 4 – Percentage possession for the bottom ranked 12 teams
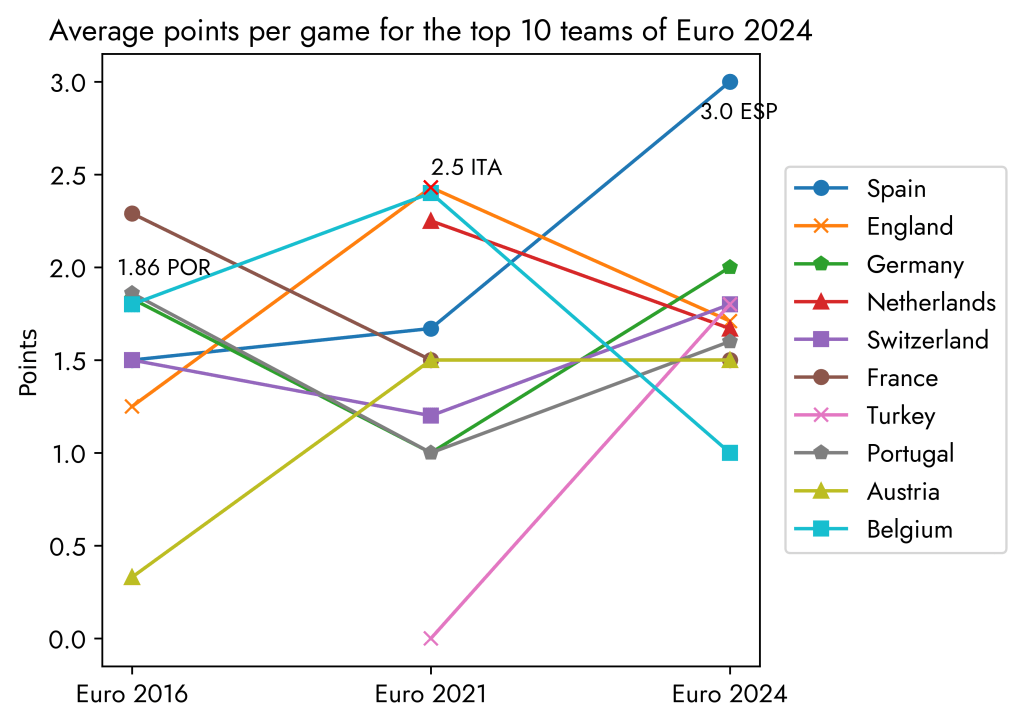
Figure 5 – Comparing average points scored per game for the top 10 ranked teams in Euro 2024 as well as their historical performance in the previous two Euros.
Not all of the 2024 teams stayed in the top 10 in previous tournaments. I have added in Italy’s average points per game for comparison since they were champions in 2021. Using this specific metric, France actually outperformed the eventual champions Portugal back in 2016. Spain’s perfect average of 3 points per game reflects their dominance in which they won every single one of their matches this year.
Gallery with Expandable Graphs


References
[1] “SoccerSTATS.com,” SoccerSTATS.com, 2024. https://www.soccerstats.com/leagueview.asp?league=euro (accessed 20/08/2024).
[2] “Creating annotated heatmaps — Matplotlib 3.5.2 documentation,” matplotlib.org. https://matplotlib.org/stable/gallery/images_contours_and_fields/image_annotated_heatmap.html
[3] “Gallery — Matplotlib 3.4.2 documentation,” matplotlib.org. https://matplotlib.org/stable/gallery/index.html
